July 26, 2021
 Cloud Team
According to Gartner’s Magic Quadrant for Analytics and Business Intelligence’19, AWS QuickSight had not made a place in the list of top BI tools. This is due to the cutting-edge competition in the BI space.
On the other hand, several benefits make it a strong contender for 2021. Therefore, it is important to know what QuickSight has to offer. As shown in the below graph, below are the primary reasons for the growth of Amazon QuickSight in the BI sphere:
 Compatible with Multiple Data Sources: The supported data sources include CSV files, file sources, SaaS data sources or various relational data sources for, say, Amazon S3, Presto, Amazon Athena, Amazon Redshift etc. In short, any kind of data which is stored in an internet-accessible environment is compatible with AWS QuickSight.
- SPICE Processing Engine: SPICE is an acronym for Super-fast, Parallel, In-memory, Calculation Engine. It is quick and easy to use as it uses columnar storage and the latest hardware, which empowers the users to run big data queries.
- Portability: It is a handy tool, accessible anytime and anywhere, for instance, laptop, smartphone, desktop, tablets. It is also accessible in offline mode.
- High Flexibility & Scalability: There are no space constraints due to cloud design, and users need not understand what’s going on behind the scenes for data processing and visualization.
- Smart and Interactive Visuals: It has a built-in visualization feature that generates suggestions as per your data set. This feature is called ‘Autograph’, which keeps on evolving as the data set matures.
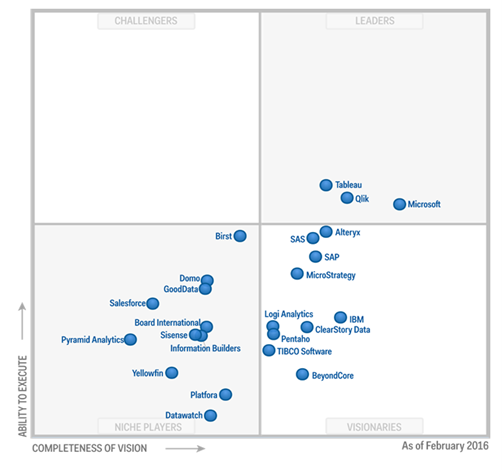

Fig 1. 2017 vs 2021 BI tool quadrant
Summing up, QuickSight is a high-speed and cloud-powered business intelligence tool that helps you build visualizations, perform ad hoc analysis, and converts your data into actionable intelligence. It is a scalable, serverless, embeddable, machine learning-powered business intelligence (BI) service built for the cloud which lets you easily create and publish interactive BI dashboards.
Sign up for an AWS account
Create an AWS account or sign in if you already have an account.
Create QuickSight account
After signing into your AWS account, open the QuickSight service from the AWS management console. It is located under Analytics.
- Click on Sign-up for QuickSight and complete the procedure.
- Choose between standard or enterprise versions as per your need.
- Select your region, enter your name, password, email-id to complete signing up.
- Some sample data will be available for a quick start.
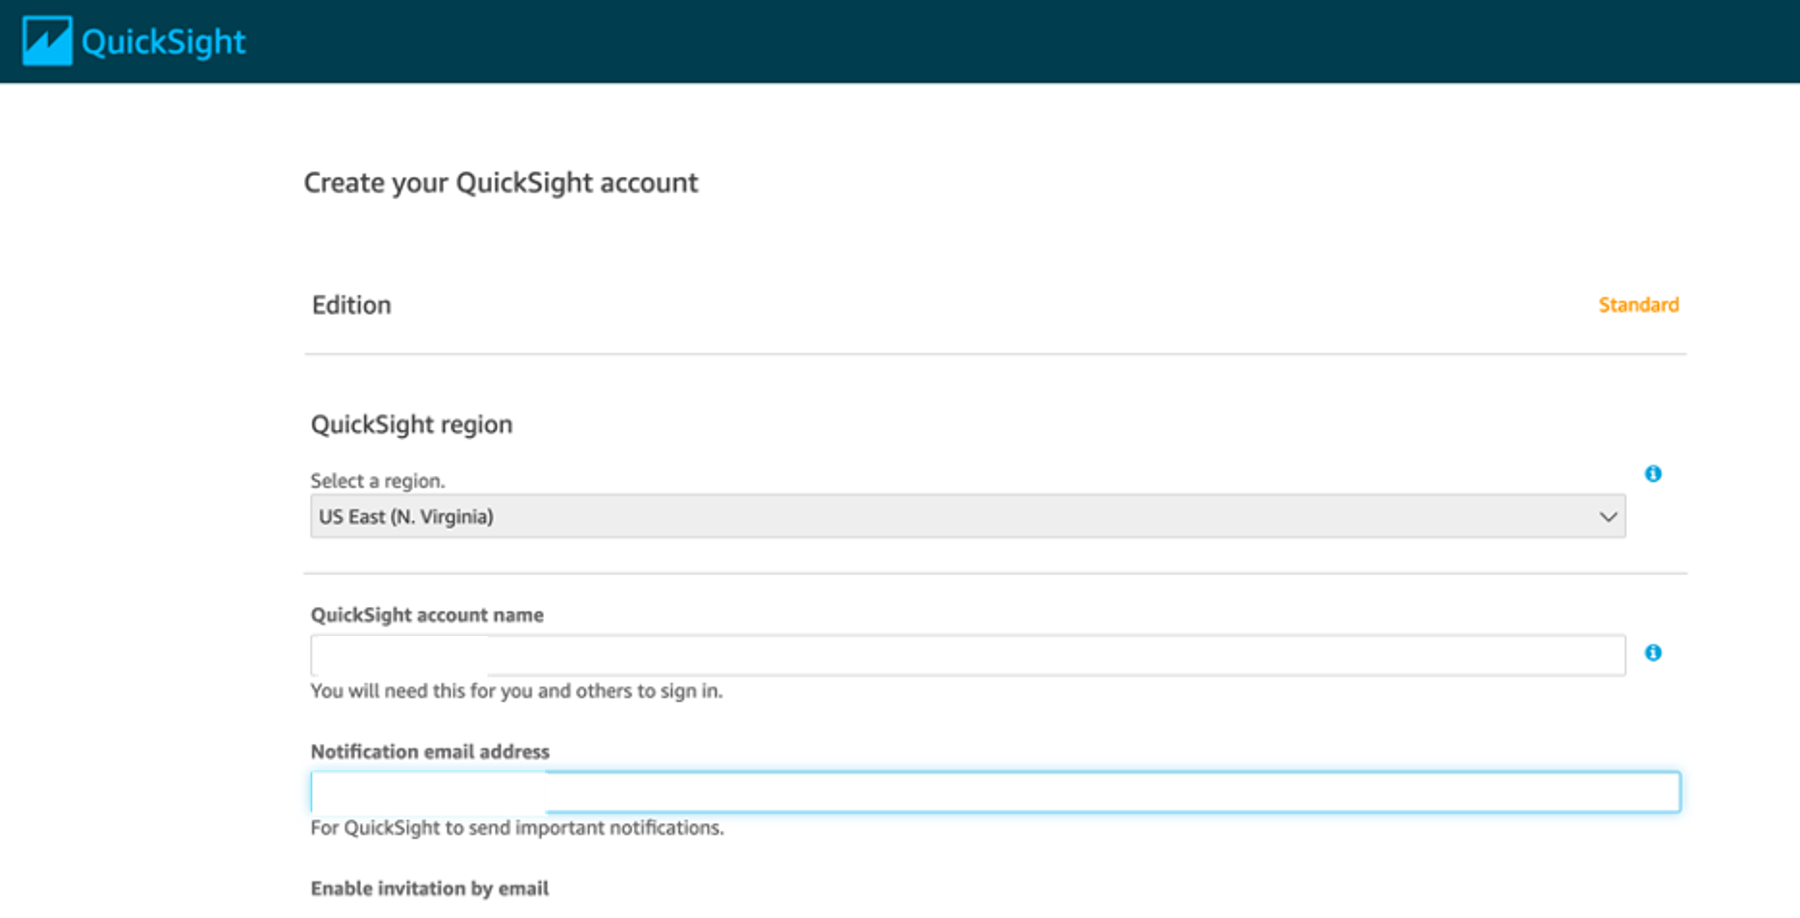
Fig 2. QuickSight account
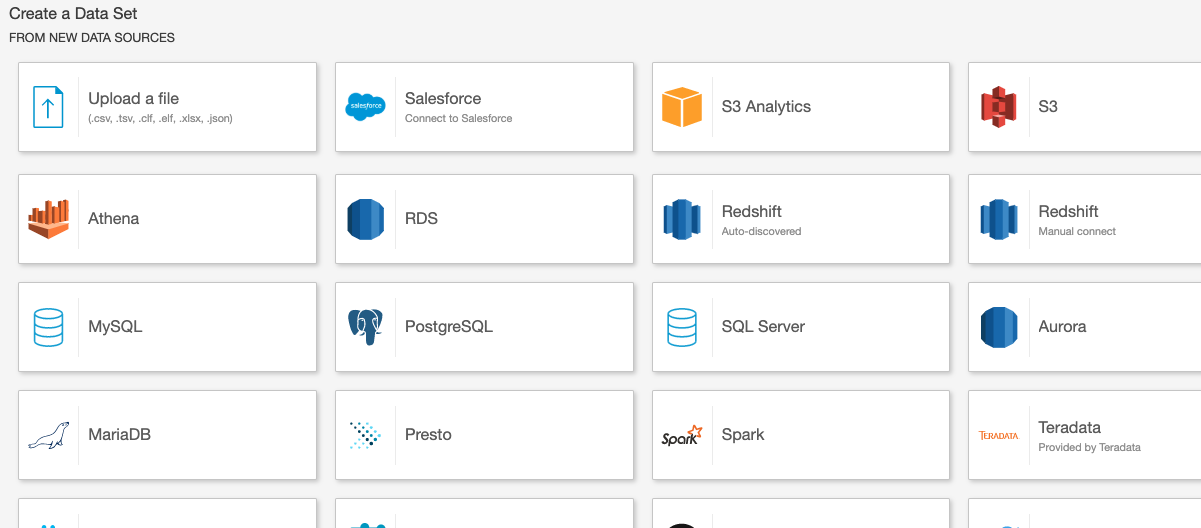
Fig 3. Data sources
Preparation of data sets
- Click on datasets from the left menu.
- Click on new dataset on the right top corner and choose the data source on which you want to create your dashboard. Here, excel sheet data is used. Select one sheet from multiple sheets and click on edit/preview data to prepare it for analysis.
- You can exclude any field, change its data type, add a calculated field, change its name by clicking on the three dots corresponding each field, and add filters and calculated fields.
- You can add another data set with previously added data set to perform a join operation by clicking on “Add data” on the top right corner. Once you add a new data set, click on two red dots between two datasets available to join.

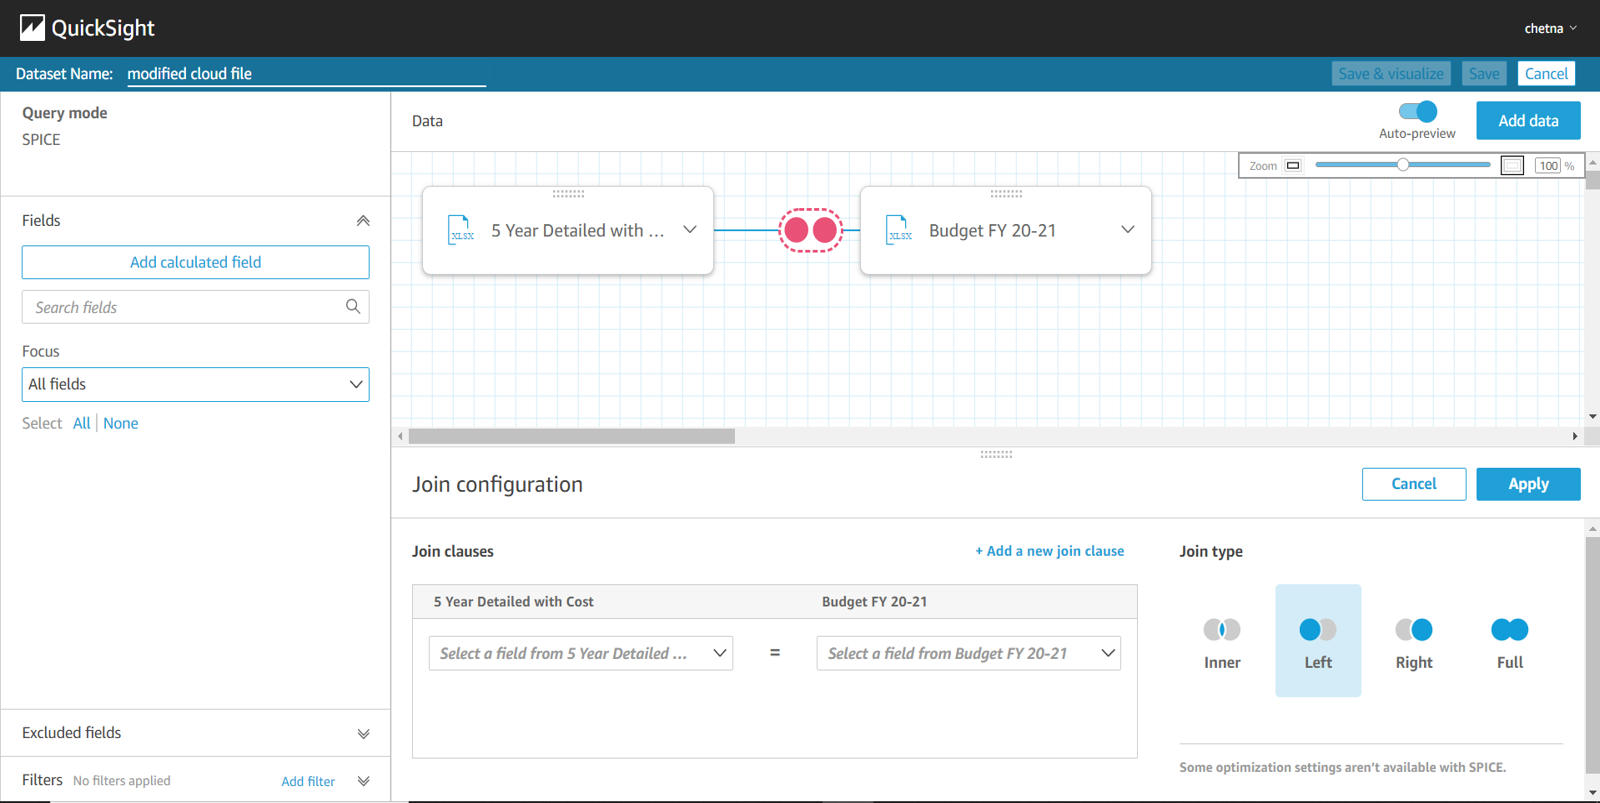
Fig 4. Data set preparation
Modifying the selected dataset
- You can update any dataset you previously added by clicking on the dataset from the list of datasets available, select edit dataset to edit it.
- Select Delete dataset to delete your dataset permanently.
- Select duplicate dataset to copy the same dataset.
Beginning with analysis
As you have your dataset, you can now create visuals and analyze using different graphs.
- Click on analysis on the left menu and then select “New analysis” on the top right corner. Choose the required dataset and click on create analysis.
- Choose fields from the field list on which you want to create your graphs.
- QuickSight has a variety of graphs available to choose from, or you can use an autograph that creates the best suitable graph according to the field you choose.
Working on visuals
- The area on which the graph is shown is the sheet. You can add more sheets to your analysis by clicking on “+” sign on the top panel. You can also rename and duplicate any sheet.
- Field value on top of sheets shows the y-axis, x-axis and color (in case of multiple fields on any axis) of fields. By clicking on the down arrow of each field, you get the aggregation, sort, formatting options. Here, you may remove or add new fields.
- There can be more than one visuals on a single sheet, and you can choose them with a simple click. As you click on the three dots corresponding to the visual, you get the options to hide/show legends, export to CSV, duplicate visual (in the same sheet), actions and delete visual.
- Click on “Filter” to add filters. Select create one and choose the field on which you want to apply the filter. Here, the Business field is selected. Thereupon, select your filter and apply filter type, filter criteria and value of fields you want to include or exclude. Click on apply and then close the button to have the filter applied on fields.

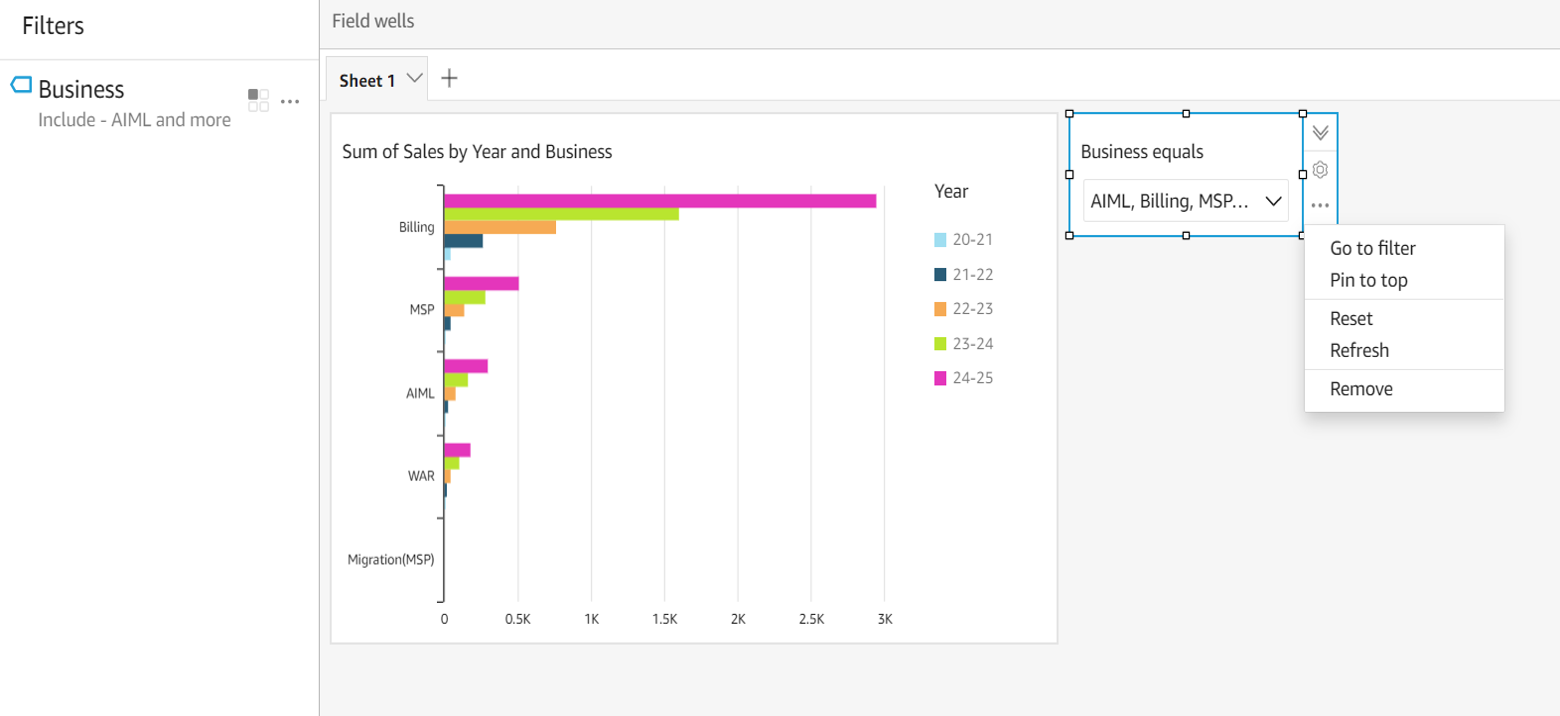
Fig 5. Visual findings
- You can also add this filter to our sheet as a drill-down menu. Click on three dots of filter and choose the “add to sheet” option.
- You may customize the graphs or visuals by changing their colours, changing background and foreground, editing font size and type through the theme menu. Click on theme from the left menu for the same.
- You can also configure the scaling setting by clicking on setting from the left menu. You will see two options to autofit or optimize according to your requirements.
- Now, as you have applied filters, you can perform the same operations from visuals. Click on any graph to get all the options related to filters and themes.

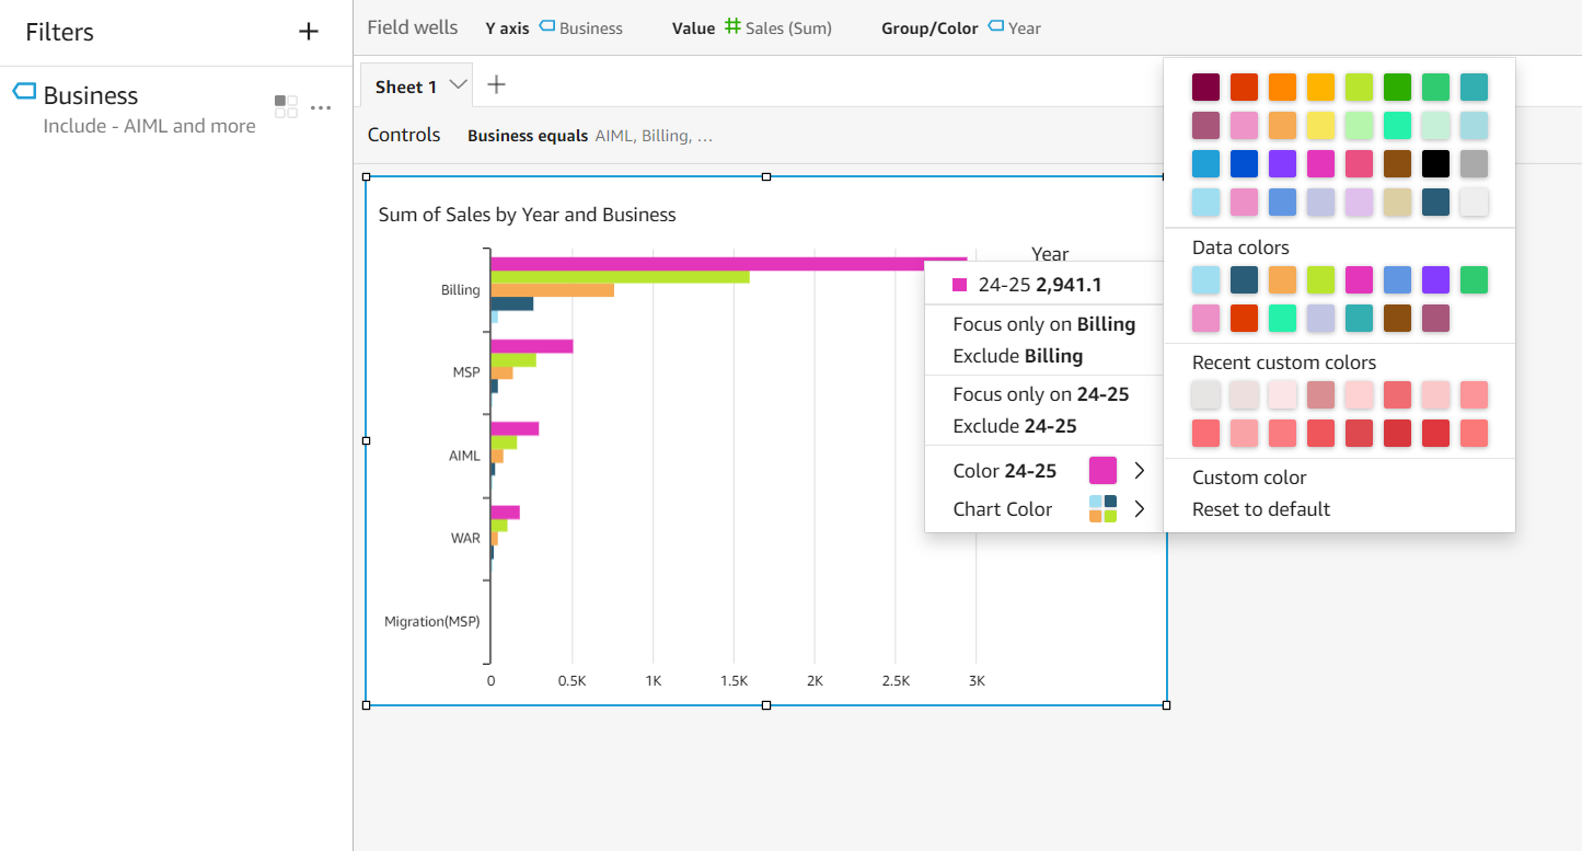
Fig 6. Filtering options
Publishing a dashboard
Your analysis is ready to be published as a dashboard. A user can only read this dashboard and apply drill-down to filter the data but cannot modify it.
- Click on share on the top right corner and click on “publish dashboard”. A popup window will open- name your dashboard and click publish dashboard.
- You can filter data from drill-downs applied on visuals on the dashboard, and as you have multiple sheets, you move to other sheets to see their visuals.
- Once your dashboard is saved, it is available on the dashboard menu on the QuickSight main page. You can also share your analysis with other users to modify them as per their needs.
- Click on share and then select share analysis. Here, you may also manage permissions to other users on how they can access your visuals.
- You can mark the crucial dashboards as a favorite for quicker access whenever needed.
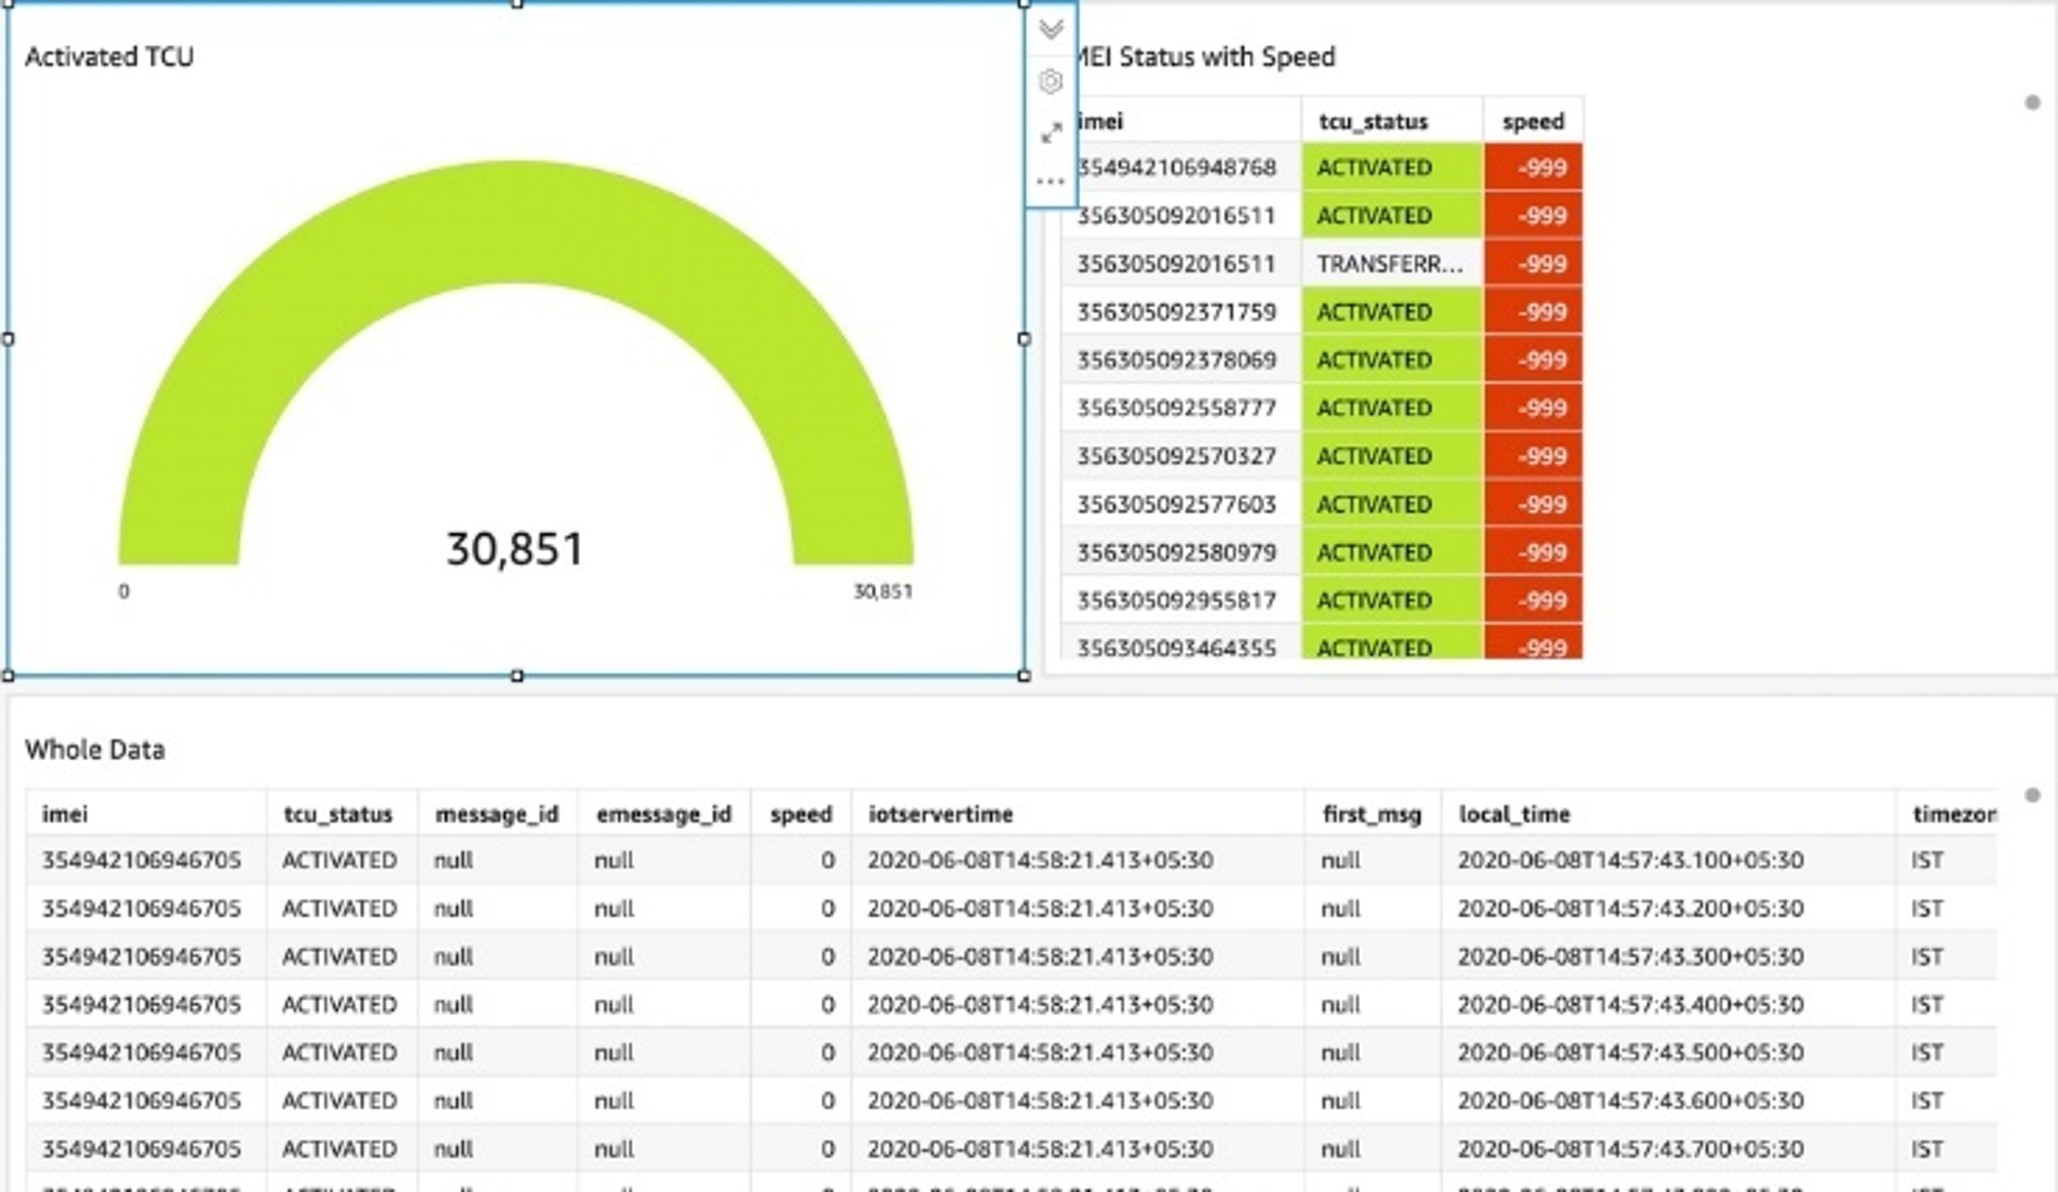
Fig 7. Published dashboard
Comparison of QuickSight with other BI tools in the market
source: https://www.csgpro.com/blog/business-intelligence-tools-comparison-chart/
The above comparison is made based on key features like real-time analytics, semantic querying, collaboration etc. Ultimately, AWS Quicksight comes out to be the most feasible option when considering the cost value of BI tools.
QucikSight is a quality and cost-effective BI solution from Amazon and is continuously evolving with new features over time. It is imperative that companies will shift their focus towards this unique solution.
To know more about AWS QuickSight, request a demo or contact us here.
About the Author:

Prachi Gulihar – ML Engineer, AI/ML Practice
Shailaja Murmu – ML Engineer, AI/ML Practice
Chetna Bundel – Data Engineer, AI/ML Practice